In a previous post Understanding Company Decisions Using Knowledge Graphs I argued that “using some Graph algorithm” it is possible to predict Google’s acquistion of data analytics company Looker. This post shows how I used “some Graph algorithm” to do that.
Translating business reasoning into technical reasoning
In the above-linked post I reasoned that:
Google acquired Looker because Google’s Cloud competitors are expanding into a segment which
- is adjacent to Cloud
- important to Google
- a segment where Google is not active
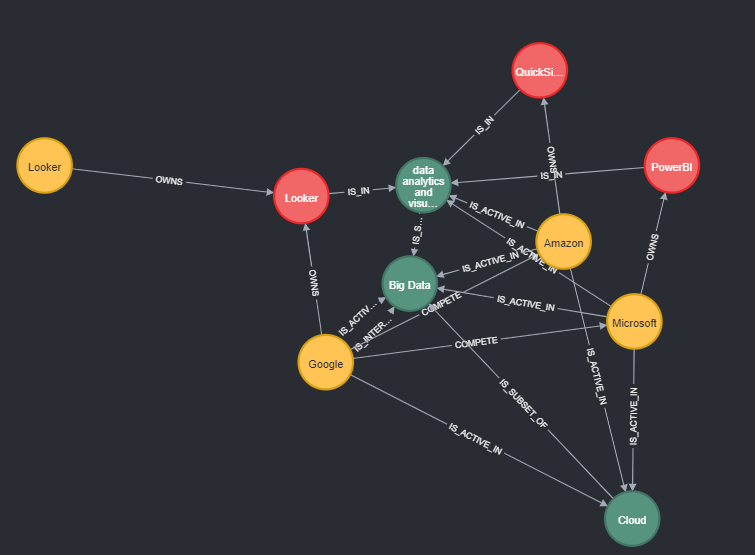
As you can see, the acquistion happened in a context. The context is that Amazon, Google, and Microsoft are active in the same industries except “data analytics and visualization” where Google is not active but Amazon and Microsoft are. In a graph, this context looks like this:
The meaning of the nodes is as follows:
- yellow nodes: companies
- red nodes: products
- green nodes: industry segements
With the data model in mind, let’s break the business requirements down and translate them into their technical counterparts.
Finding strategic differences between companies using graph visualiziation and calculated ompany similarity
Google’s Cloud competitors are expanding into a segment where Google is not active. This means that based on industry segments Google, Amazon, and Microsoft have strategic differences. In the graph below this is depicted by the relationships between companies and industry segements.
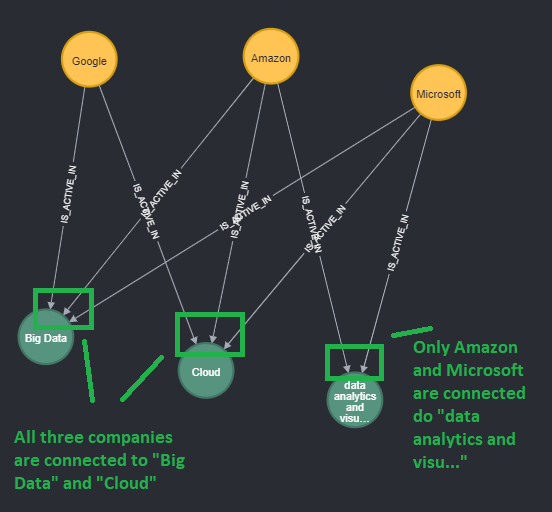
Whereas all three companies are connected to “Big Data” and “Cloud”, only Amazon and Microsoft are connected to “data analytics and visualization”.
Besides vis visualization, an effective way to identify these gaps is to calculate the similarity between companies based on the industry segments they occupy. The table below depicts this similarity. As expected, Amazon and Microsoft are identical, Google and Amazon/Microsoft differ.
| Company pair | Similarity in percent |
|---|---|
| Amazon/Microsoft | 100 |
| Google/Amazon | 67 |
| Google/Microsoft | 67 |
To close this strategic gap, Google must find a fitting industry segment.
Finding the right industry segment to close the strategic gap
If Google wants to catch up to Microsoft/Amazon, it has to find a fitting industry segment. Fitting is described as a segment central to the current context. We can find the central segment – “data analytics and visualization” – by looking at the graph:
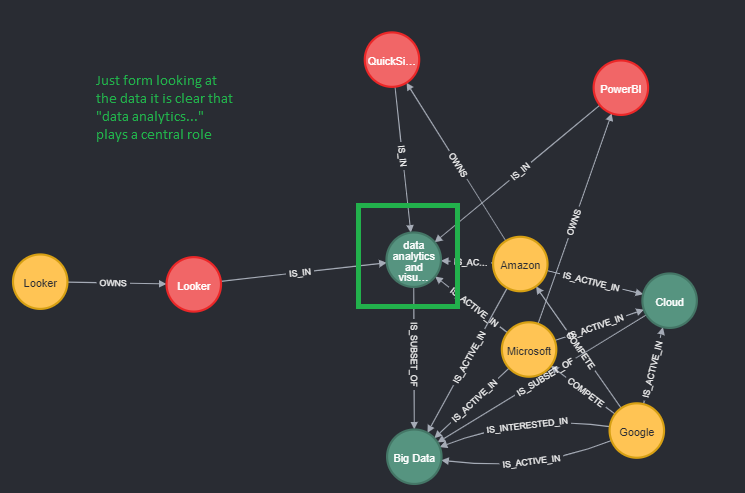
Hower, it makes more sense to identify this segment algorithmically.
Finding the right target market using Graph algorithm
There are several ways to determine which industry segment is essential for Google’s expansion. One way is to find industry segments that separate the graph into parts.
In this case, the so called Betweenness Centrality-algorithm shows that “data analytics and visualization” separates the graph. The higher the centrality score, the more relevant the industry segment.
| Industry segment | Centrality score |
|---|---|
| data analytics and visualization | 4 |
| Big Data | 0 |
| Cloud | 0 |
On the right side of “data analytics and visualization” we have the fully connected graph. And on the left side we have the outlier “Looker”. Thus, if Google wants to close this “strategic gap” they should connect with Looker (i. e. acuqire them).
And indeed, after connecting Looker and Google, the Centrality score for “data analytics and visualization” goes down to zero:
| Industry segment | Centrality score |
|---|---|
| data analytics and visualization | 0 |
| Big Data | 0 |
| Cloud | 0 |
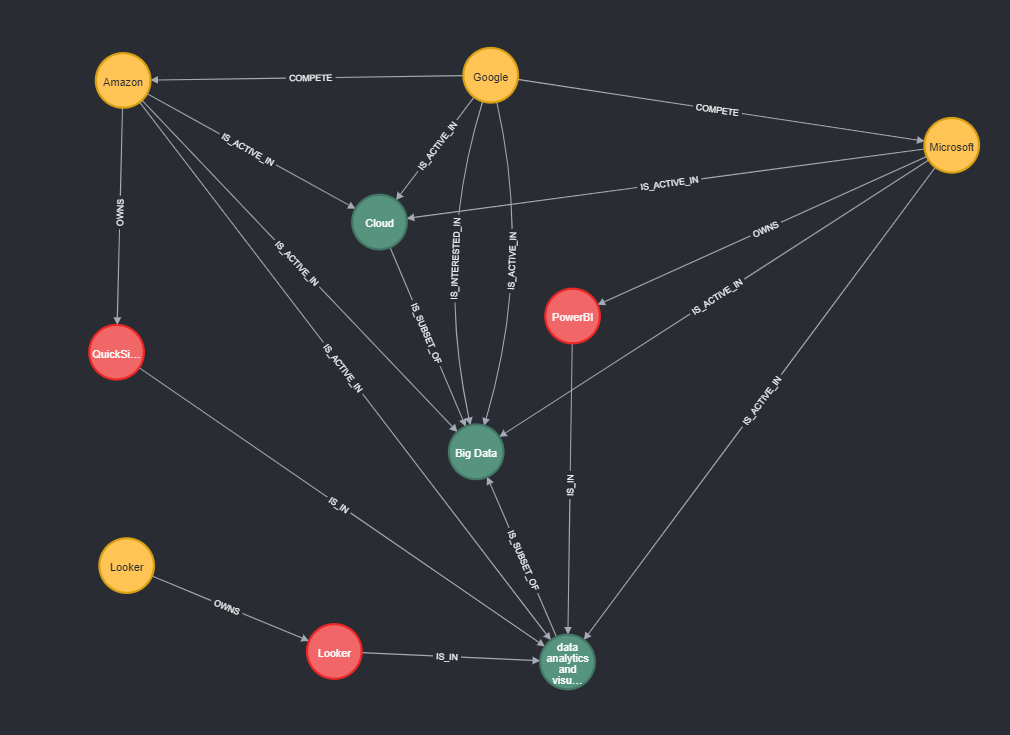
The updated graph after including Google’s acquisition looks like this: