Recently I read this article (Cloudera adds data engineering, visualization to its Data Platform) and wondered why it was relevant. To an industry-expert the implications are clear, but to me – an industry-novice – not. This situation made me wonder how a knowledge graph can be used to automatically answer the “why” behind a company’s decision.
Based on an innovation process in patent analysis, I came up with this process:
- I manually identified a similar article (Tech and Antitrust Follow-up, Google Buys Looker, Salesforce Buys Tableau; paywall)
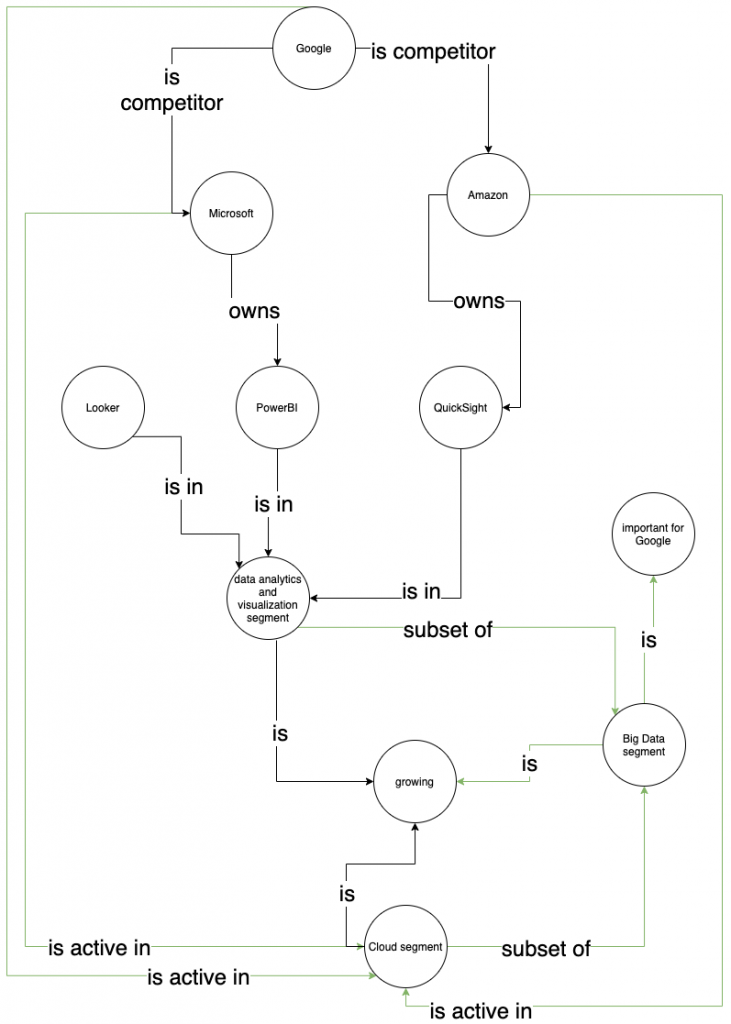
- From this article, I constructed the knowledge graph below. I defined explicit relationships (as mentioned in the article) and implicit relationships (in green; these relationships can be inferred from an external knowledge source like Wikipedia)

The knowledge graph depicts the following points:
- Google’s biggest competitors (Microsoft and Amazon) own tools in the data analytics and visualization segment (Looker’s segment)
- the data analytics and visualization segment is important to Google because that segment is part of the “Big Data movement” (implicit relationship) and “Big Data” is important to Google (implicit relationship)
- Google does not own any tools in the analytics segment
Based on this information, it makes sense that Google acquired a tool in the data analytics and visualization segment.
Re-stating the reasoning from the base article: Google acquired Looker because Google’s Cloud competitors are expanding into a segment which
- is adjacent to Cloud
- important to Google
- a segment where Google is not active
From a technical standpoint, this means predicting the relationship “Google -[owns]-> Looker” (using some Graph algorithm).
Having established this base graph, understanding the original article (Cloudera adds data engineering, visualization to its Data Platform) becomes a matter of replacing Google with Cloudera and Looker with Cloudera Data Visualization.