I recently read this article: Qlik übernimmt Blendr.io. From the article it was clear what happened:
Qlik a Business Intelligence-company acquired Blendr.io, a Data Integration-company.
However, I was wondering: What am I missing? What information is not evident from the article alone.
To answer this question I built a knowledge graph. The knowledge graph consists of companies, industries, and company strategies that are related to Qlik and Blendr.io.
An overview of the knowledge graph is shown in the image below:
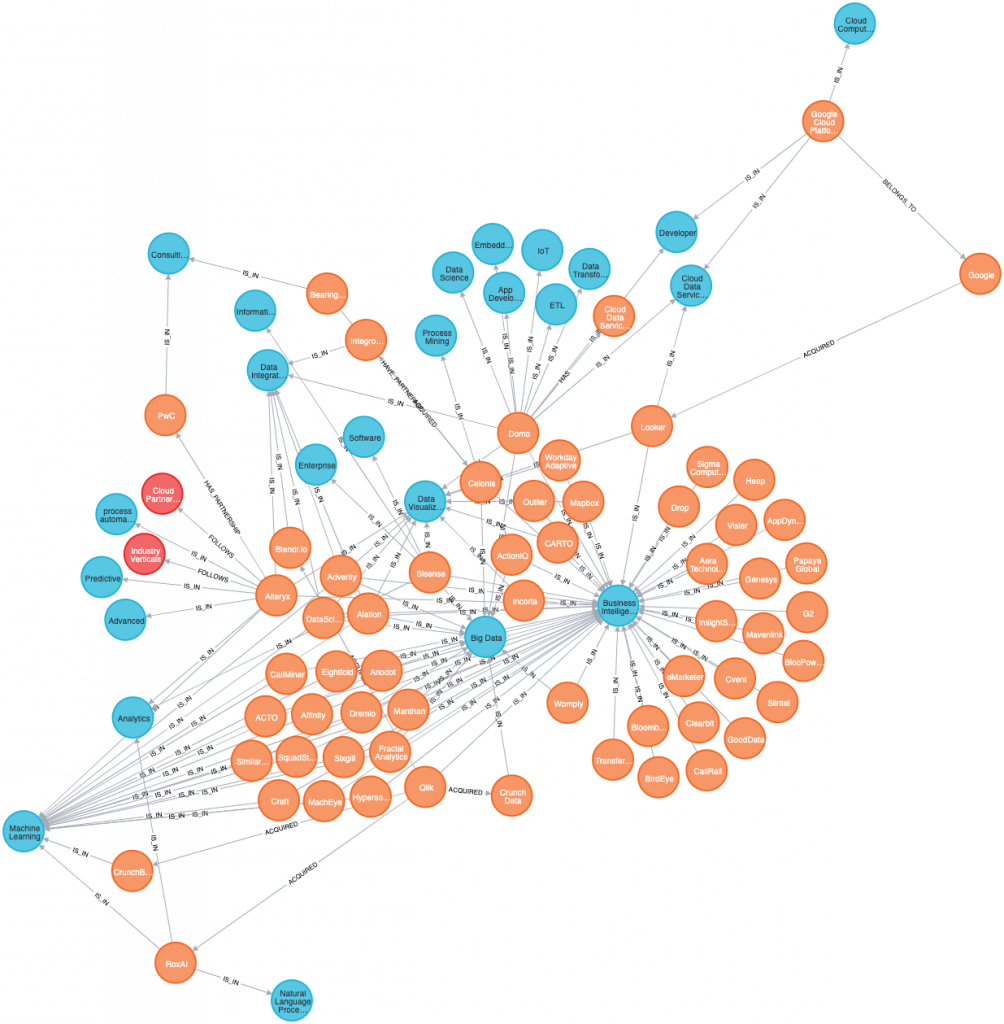
The meaning of the colors are as follow:
- orange: represents a company
- blue: represents an industry
- red: represents a company strategy
There a several reasons why such a knowledge graph can answer the question ‘What am I missing?’. They are explained below.
There is more to it than just ‘Qlik acquired Blendr.io’
The image below shows two graphs:
- in the upper left corner you see the basic graph that represents ‘Qlik acquired Blendr.io’
- in the remaining image you see the full picture with all the relationships that Qlik and Blendr.io have
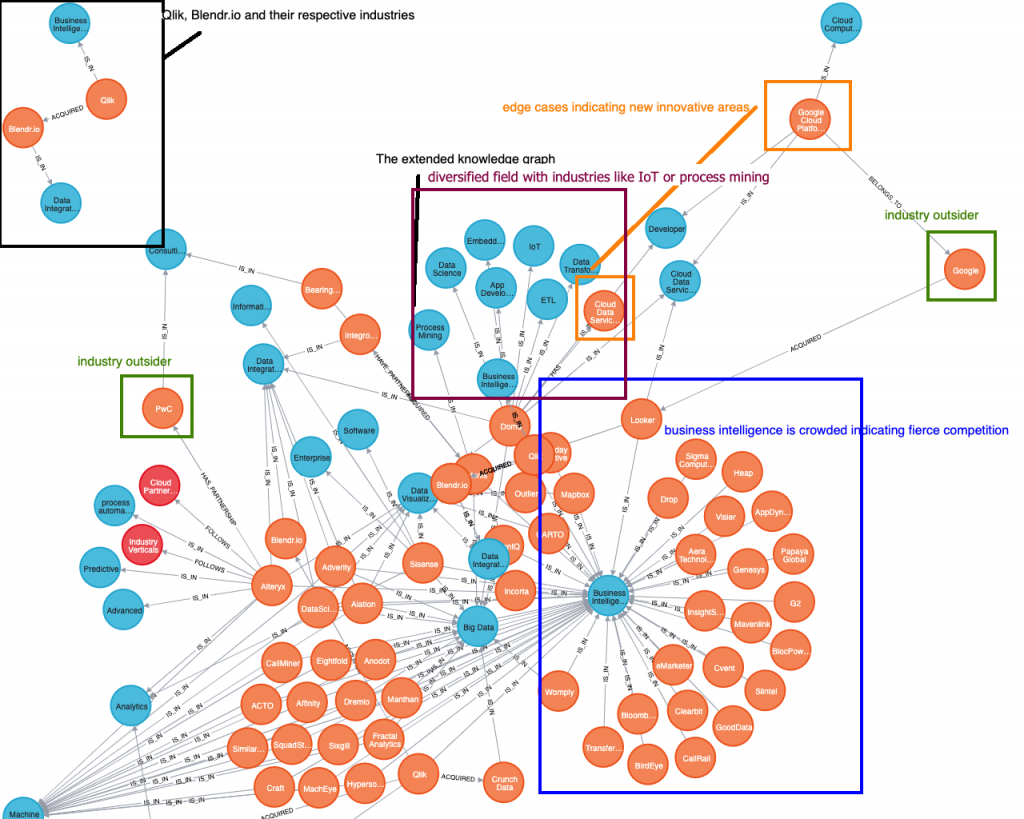
It is immediately clear that ‘Qlik acquired Blendr.io’ is too simplistic. If you look at the whole graph you immediately notice:
- industry outsiders like Google or PwC are active in this field indicating shifting industry trends
- the business intelligence space is very crowded indicating fierce competition
- there are edge case with little activity like ‘Cloud’ indicating new innovative areas
- it is a diversified field with industries like IoT or process mining
- companies have diversified relationships with each other:
- there are partnerships
- there are acquisitions
Besides these general observations you can also derive several specific observations:
- Discover innovation opportunities via white spaces
- Analyze company strategies: diversification
- Measure competition via hot spots
- Identify partners, competitors, or acquisition targets
Discovering innovation opportunities via white spaces
Knowledge graphs are useful for the identification of innovation opportunities.
This is done via so-called ‘white space-analysis’: A white space is an area – centered around a node – that has only a few nodes connected to it; for a company, this signalizes a potentially new industry, segment, or product.
In the graph below this is, for example, ‘Cloud Data services’.
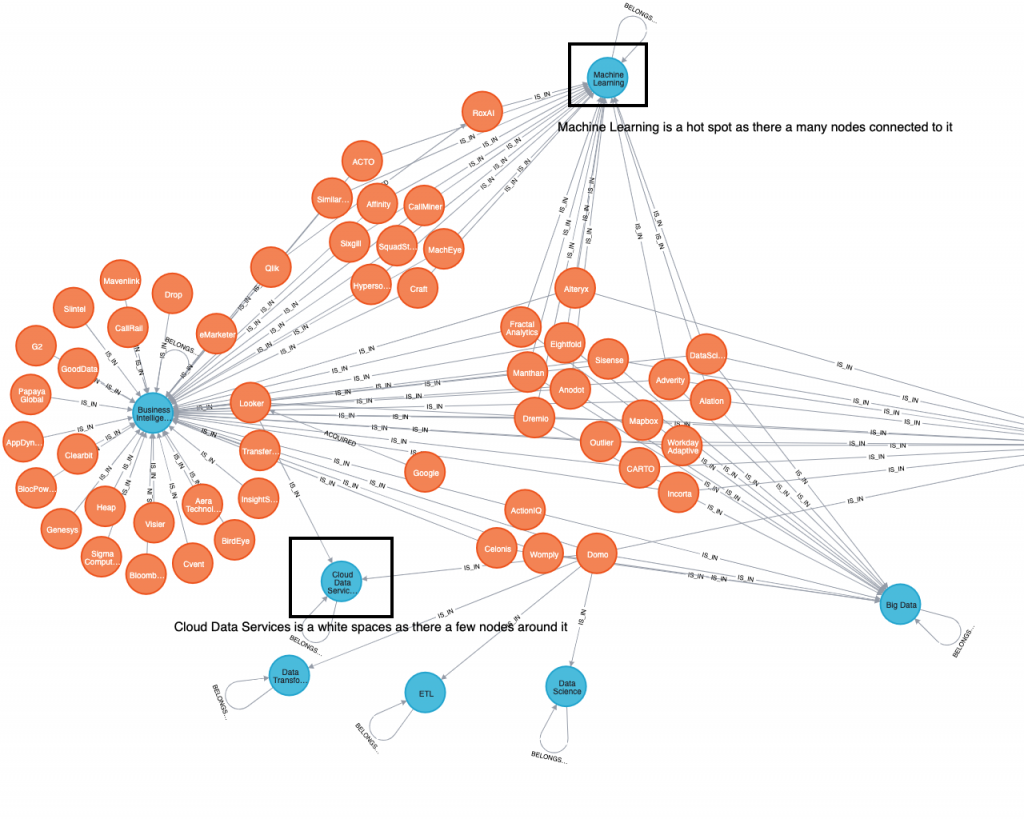
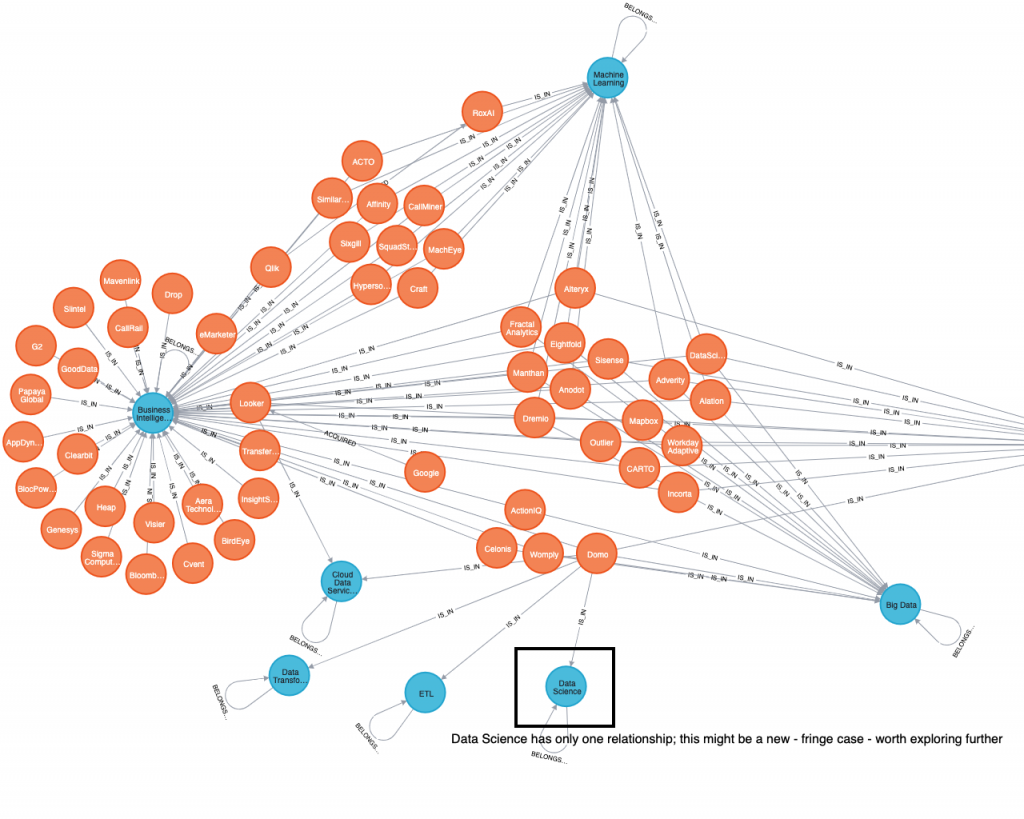
Such a ‘white space-analysis’ is also useful to identify fringe cases which might signalize trends or new segments.
For instance, in the image below, Domo is the only company in the field of ‘Data Science’.
Analyze company strategies: diversification
By analyzing companies that are related to more than one industry, you can uncover the diversification strategy these companies apply.
The knowledge graph below shows that companies that are in business intelligence are also in Machine Learning or Big Data (inside the green squares).
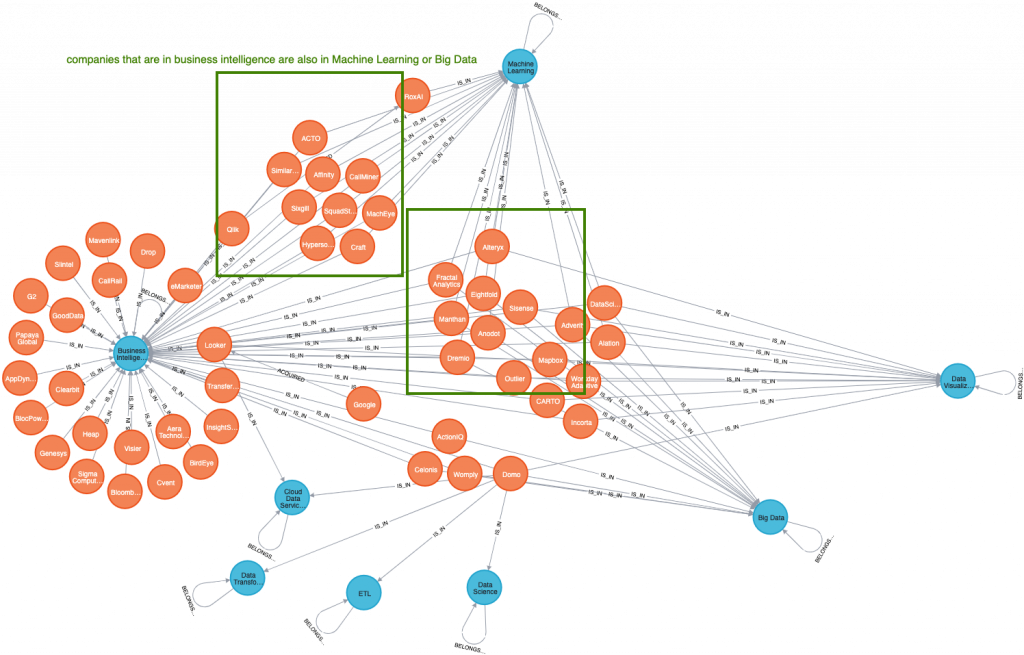
In other words: for a business intelligence-company it is not enough to just offer business intelligence, they must diversify into other areas.
Measure competition via hot spots
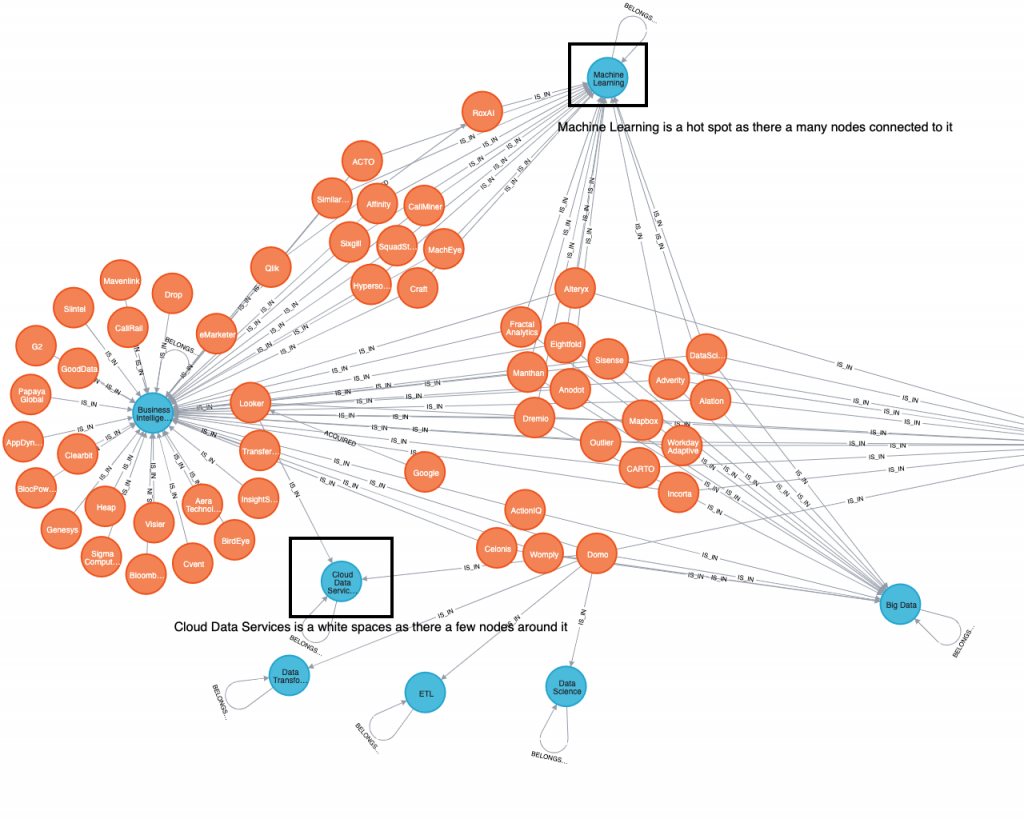
A hot spot is an area – centered around a node – that has many other nodes connected to it. For a company, this signalizes a segment with fierce competition.
In the image below one such field is ‘Machine Learning’.
Identify partners, competitors or acquisition targets
Another area where knowledge graphs are useful is for the identification of ‘somewhat close’ companies. Such companies are companies that indirectly related to ‘our’ company and could thus be partners, potentially new competitors, or acquisition targets.
Identify partners
The two graphs below show the partnership between the consultancy PwC – and business intelligence company Alteryx
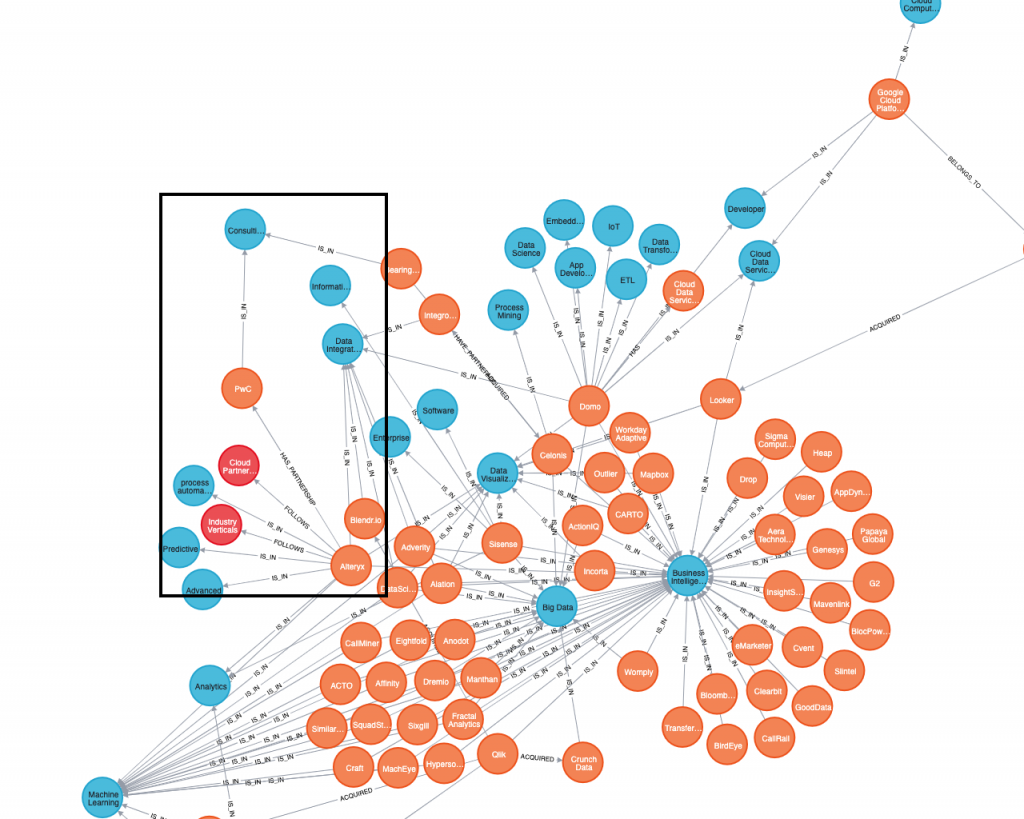
The enlarged version of the black square from the graph above:
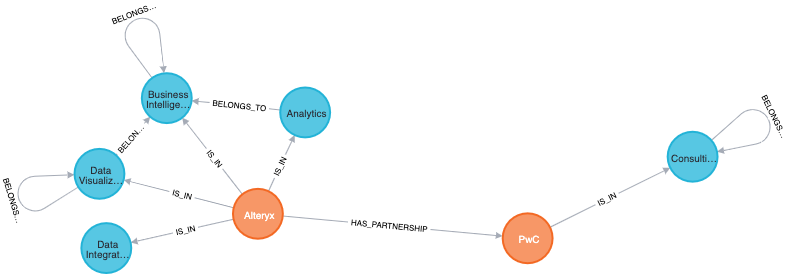
If you use the knowledge graph to expand your ‘knowledge’ about PwC these partnerships might not surprise you at all because PwC has always been associated with Business Intelligence, as the graph below shows (the graph below is a subsection of the whole graph).
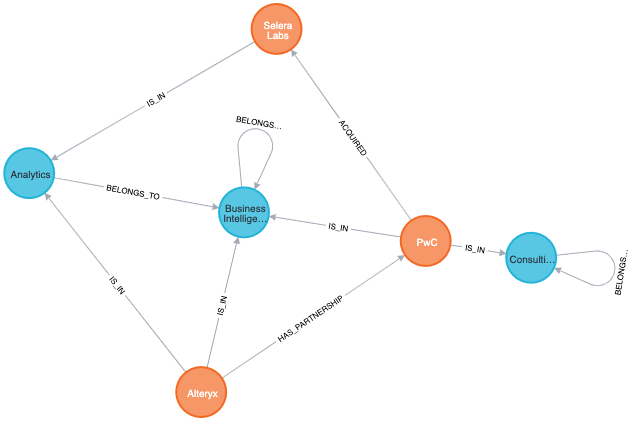
In the graph above you see that PwC acquired Selera Labs (in 2016) a company in the analytics space. In the graph you also see that ‘Analytics’ belongs to ‘Business Intelligence’. Based on this, it is not surprising that PwC is moving further into the Business Intelligence field by partnering with companies from that space.
Identify competitors or acquisition targets
A knowledge graph can also be used to identify potential acquisition targets or company strategies.
BearingPoint, a consultancy, provides an example exemple to demonstrate this. The graph regarding BearingPoint is shown below. Again, this is a subsection of the whole graph.
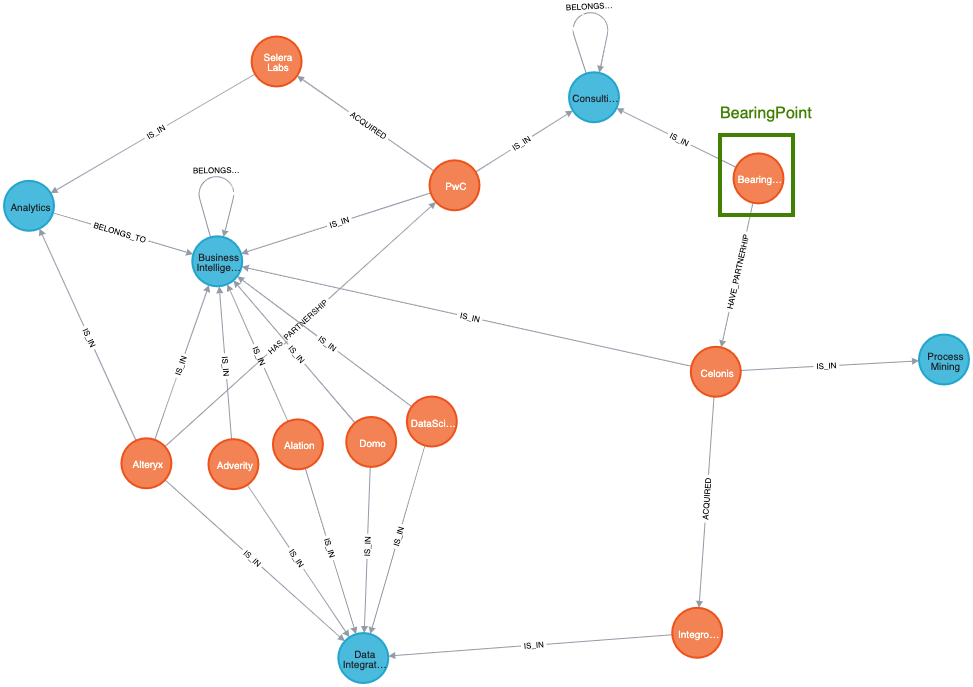
The graph shows:
- BearingPoint partnered with Celonis
- Celonis is a Data Integration company – through their acquisition of Integromat
- Many companies that are a Data Integration company – such as Alterxy – are also a Business Intelligence company
Although it is not a direct relationship, BearingPoint is still somehow related to Business Intelligence.
Based on the PwC pattern above – PwC acquired a company in the Business Intelligence field and is also partnering in this field – one could assume that BearingPoint might also acquire somebody from that space.