Recently CB Insights published a FinTech-report titled The State Of Fintech Q3’20 Report: Investment & Sector Trends To Watch
This post shows how a knowledge graph can be used to automatically generate such a report.
About knowledge graphs
A knowledge graph consists of two parts: a node and a relationship. A node represents an entity (a company, an industry, etc.). A relationship represents how two nodes are connected.
In this case, the knowledge graph’s nodes are:
- companies
- the offerings that these companies launched
- the industries in which these companies are
- the companies that invested in these companies
The relationships are:
- company “IS IN” industry
- company “INVESTED IN” company
- company “launched” offering
The graph below shows an excerpt of the whole graph:

For instance, you see
- three companies that invested in Revolut
- that Revolut is in the FinTech-industry
- that Revolut launched commission-free stock trading
With this in mind, the remaining post shows how graph algorithms for anomaly detection can generate the above-mentioned report.
Anomaly detection
Anomaly detection is used to find rare nodes or relationships which are significantly different from the remaining data. Such nodes or relationships signalize unoccupied industries or segments for innovations or new markets.
Consider this insight from the report: “Opportunities abound with older demographics”
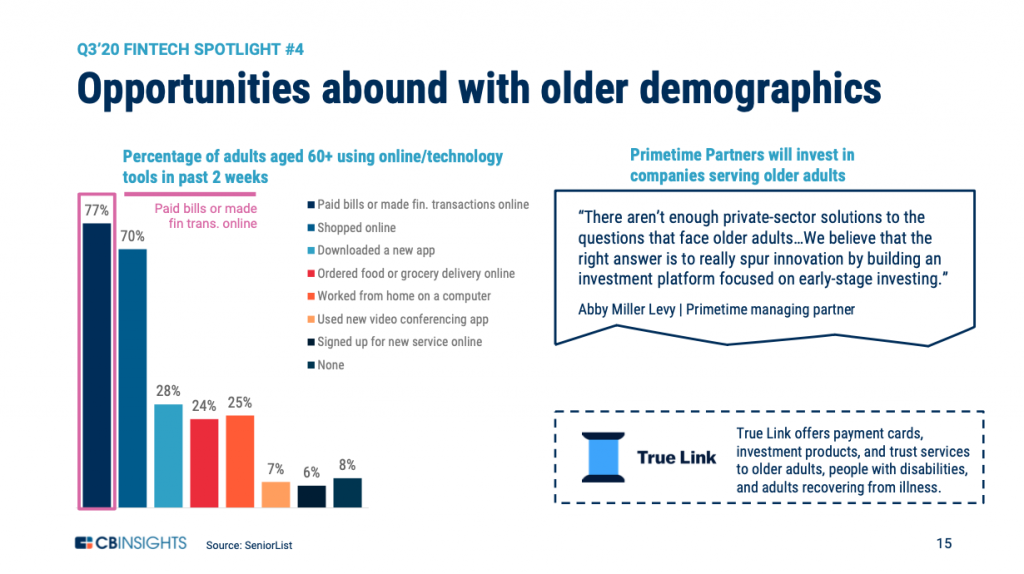
Once we have a knowledge graph consisting of companies and their target markets it is easy to derive “Opportunities abound with older demographics” by using anomaly detection.
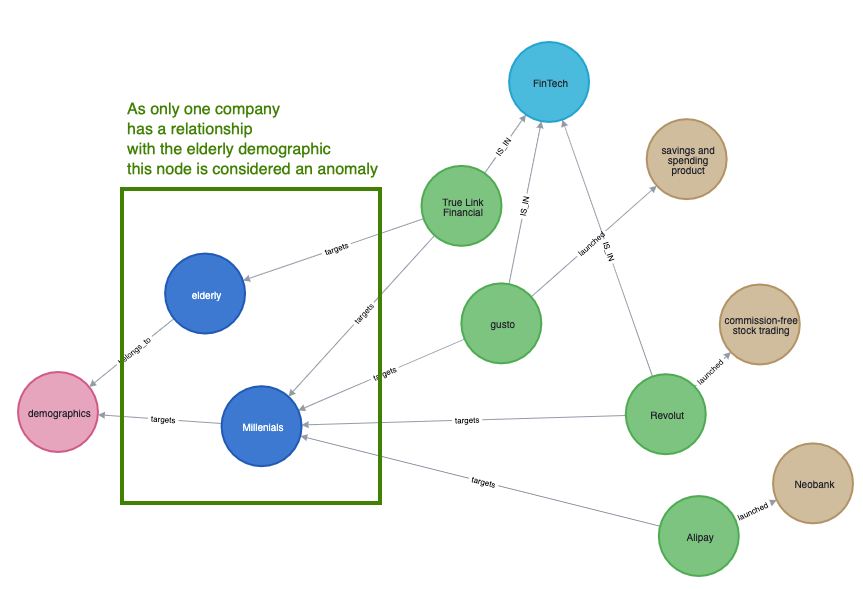
According to the graph above only one company has a relationship with the elderly demographics. Thus this demographic is considered an anomaly – and a potential new market.
However, the graph above has one drawback. It is too simplistic. Consider the graph below that shows multiple other demographics (blue circles):
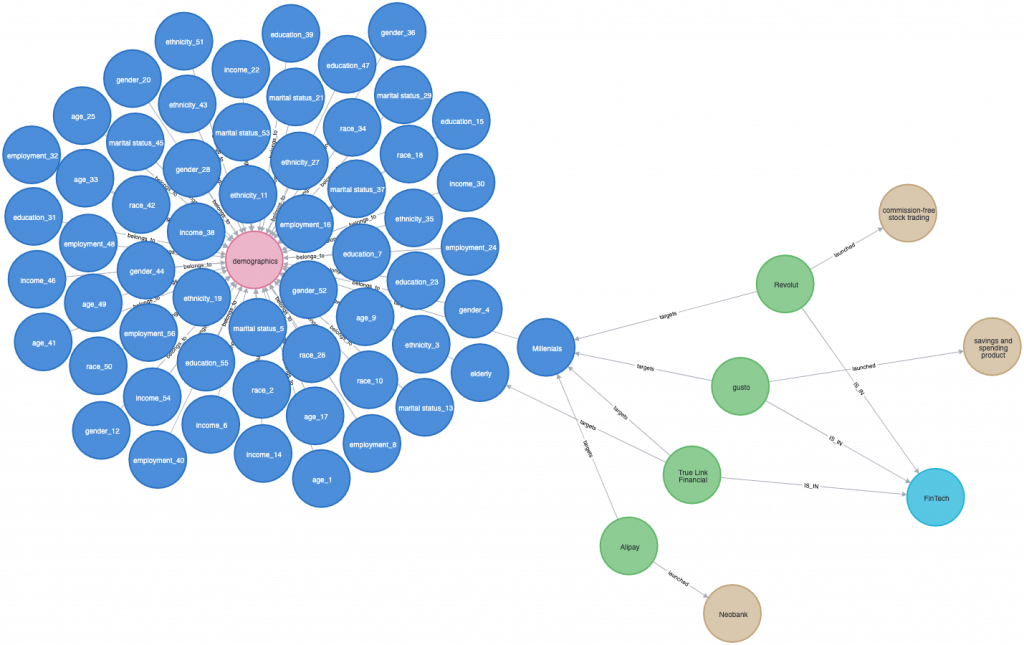
With this graph, it becomes more difficult to find reliable anomalies. Knowledge graphs provide a solution to this: integrating other sources like the article in the report (the bar chart on the left in the slide above).
The graph below has integrated the article from the slide that reads: “elderly use online/technology tools”
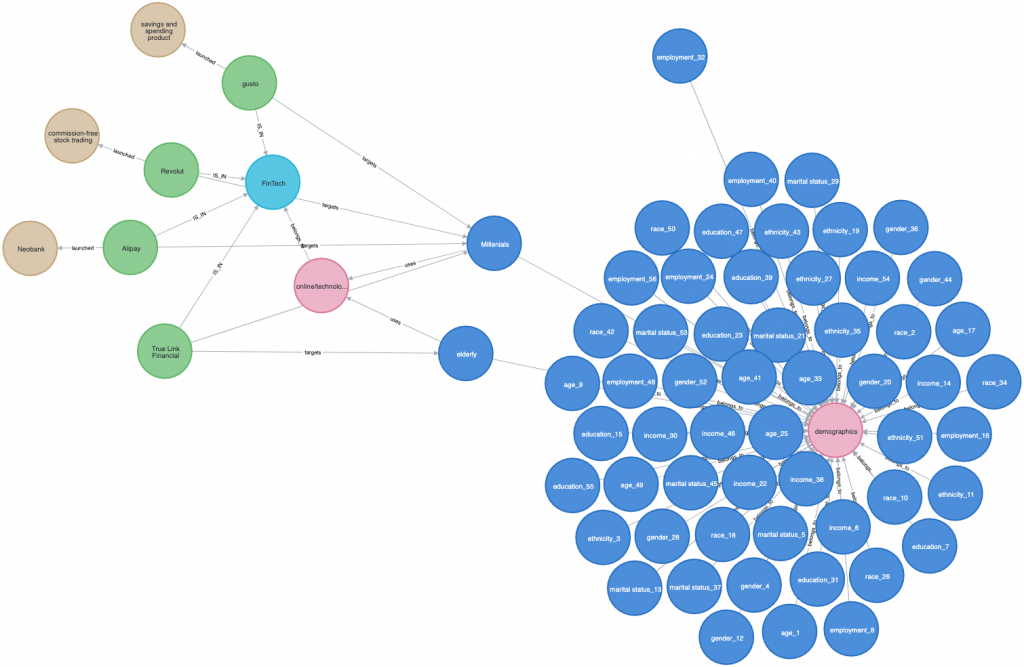
It shows the following:
- Millennials and elderly use online/technology tools
- online/technology tools are a subset of FinTech
- every FinTech-company targets Millenials but only one company targets elderly
In other words: the elderly are using services in the FinTech segment, but not all companies from the FinTech-segment are serving them.
By looking at it from this perspective, it becomes strange why the elderly were not targeted sooner.
A final extension to the graph above is to integrate other industries. For instance, by including Wells Fargo (banking-industry). Among other things, Wells Fargo targets the elderly by offering services around Retirements.
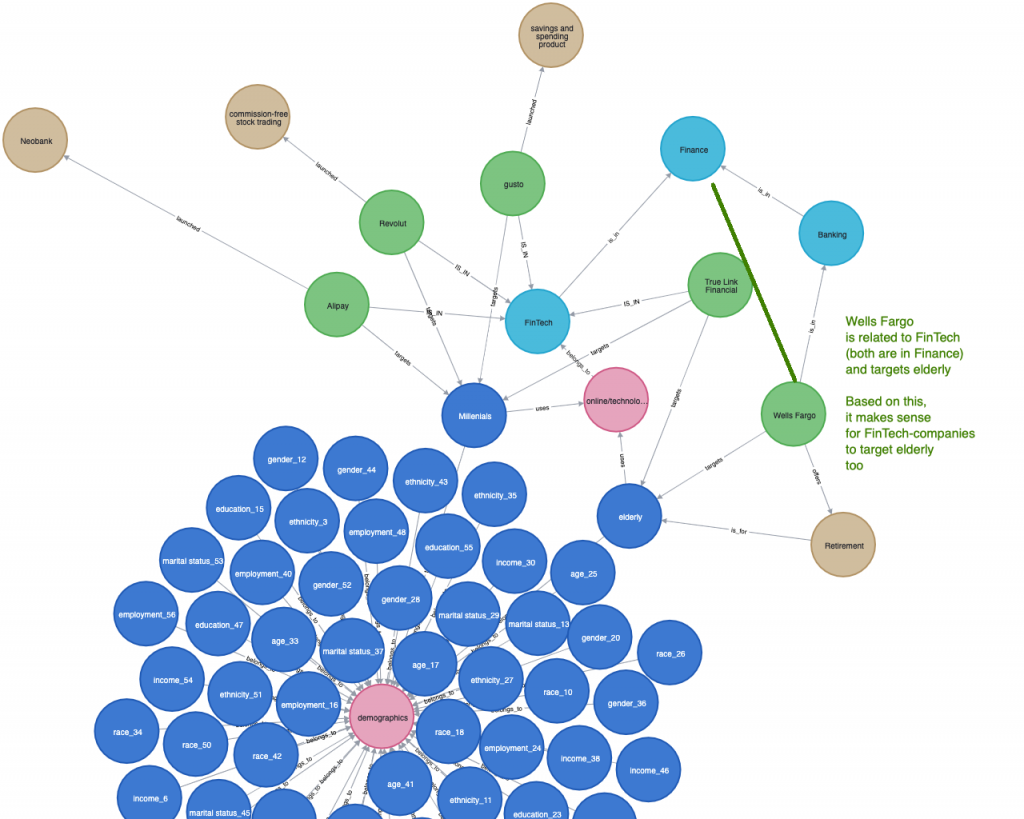
Wells Fargo is related to the FinTech-companies because FinTechs and the banking industry both belong to the Finance industry.
By including this perspective, it makes even more sense that: “Opportunities abound with older demographics”.